FMI U.S. Engineering and Construction Outlook: Third Quarter 2020 Report
Recent economic disruptions considered in the following forecast include the domestic and foreign impact of COVID-19, high volatility across financial and equity markets, emergency policies set in place by the Federal Reserve, lower oil prices, and mounting political uncertainty in addition to nationwide social unrest headed into the 2020 presidential election.
Based on unprecedented government support, FMI is anticipating the 2020 recession to continue to dissipate. However, anticipated corrections across residential markets are at risk of contributing toward ongoing economic losses and an elongated downtrend in nonresidential construction spending over the next several years.
Key Takeaways
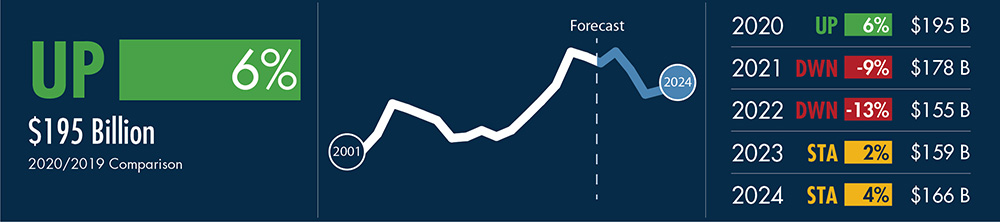
Total Construction Put in Place
Estimated for the United States
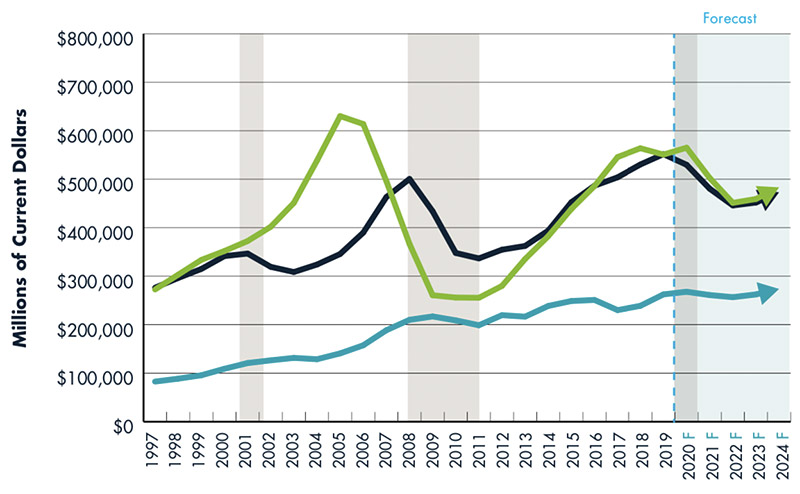 Throughout the value of construction put in place includes the cost of architectural and engineering work.
Source: U.S. Census and FMI Forecast
Total Construction Spending Put in Place 2019 and Forecast Growth
(2019-2024 CAGR) by Metropolitan Statistical Area
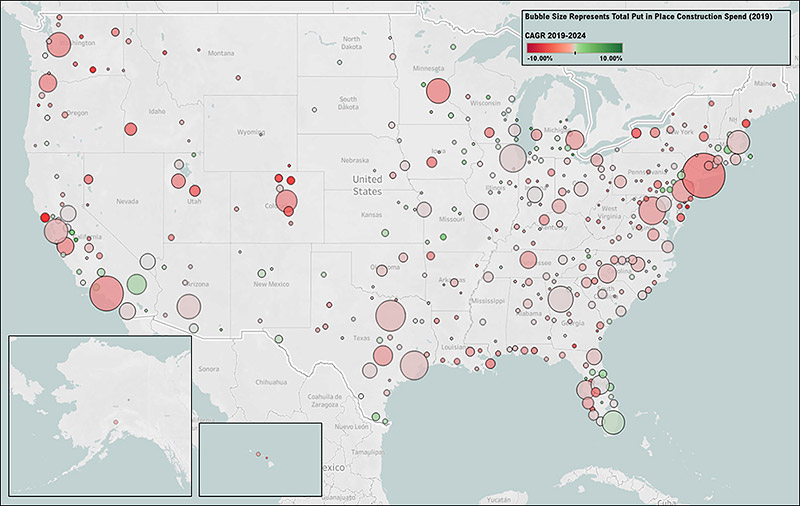 Source: U.S. Census and FMI Forecast
RESIDENTIAL CONSTRUCTION PUT IN PLACE
Single-Family Residential
- NAHB/Wells Fargo Housing market index reports builder confidence at all-time highs despite historic rise in input costs
- Slow migration out of crowded metropolitans into low cost of living cities and states
- Expect heightened unemployment rates to weigh on inventories, prices and consumer confidence as government programs reach expiration
- Geographic diversity results in new economic hubs alongside demand for supporting infrastructure and services
Drivers: Unemployment rate, core CPI, income, mortgage rate, home prices, housing starts, housing permits
Multifamily Residential
- Anticipate disruptions to planned large-scale, mixed-use developments, mostly due to uncertain demand for nonresidential components
- Buyers and renters are increasingly transient in both living and employment obligations
- Heightened unemployment and volatility favor rentals
- Transition away from high-rise to mid- and low-rise starts
Drivers: Unemployment rate, core CPI, income, mortgage rate, home prices, housing starts, housing permits
Improvements
-
- Extended work-from-home circumstances, shifting migration, aging inventories and increased refinance activity support heightened demand for improvements spending through 2020
- Expect corrections in residential prices, inventories and confidence levels to lower demand upon expiration of government programs
Drivers: unemployment rate, core CPI, income, mortgage rate, home prices, housing starts, housing permits
Nonresidential Construction Index (NRCI)
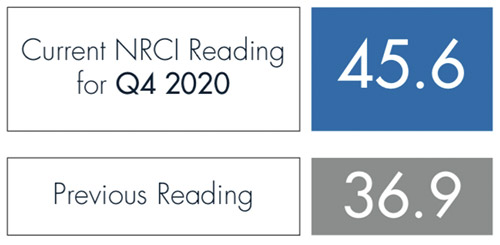 NRCI scores are based on a diffusion index where scores above 50 represent improving or expanding industry conditions, a score of 50 represents conditions remaining the same, and a score below 50 represents worse conditions than last quarter (or contraction).
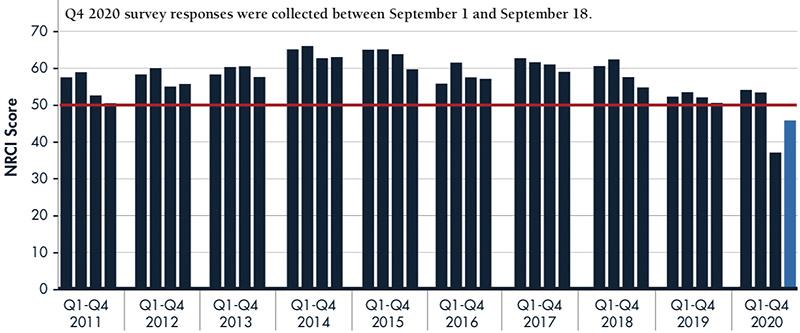 The data in the NRCI is presented as a sampling of construction industry executives voluntarily serving as panelists for this FMI survey. Responses are based on their experience and opinions, and the analysis is based on FMI’s interpretation of the aggregated results.
NONRESIDENTIAL CONSTRUCTION PUT IN PLACE
Lodging
- COVID-19 cases, layoffs, and bankruptcies have caused major disruptions to travel (both business and leisure) nationwide
- Occupancy rates and RevPar begin upward slowly, but are expected to remain depressed well into (and possibly beyond) 2021
- New demand expected to follow suburban migration, future losses tied to reduced large scale mixed-use and transportation investments
Drivers: Occupancy rate, RevPAR, average daily rate, room starts
Office
- Ongoing bankruptcies, closures and remote working preferences will weigh on demand for future traditional office space requirements
- Rapid expansion of data center investment continues alongside 5G deployment, IoT expansion and increased e-commerce and remote working adoption
- Office dedensification renovations and increased adoption of shared working spaces are expected to drive activity in both large metropolitans and suburban markets
Drivers: Office vacancy rate, unemployment rate
Commercial
- Ongoing/increasing bankruptcies and store closures into 2022
- Demand for warehouse and distribution picks up across all facility types; repurposing existing stores and shopping malls becomes more common place
- Future losses tied to reduced/revised mixed-use investments and increasing vacancies
Drivers: Retail sales, CPI, income, home prices, housing starts, housing prices
Health Care
- Newly realized needs suggest a potential resurgence in larger health care campuses and hospital expansions
- Rapid adoption of telehealth significantly challenges existing capital plans
- Demand and adoption for health care services and technologies (e.g., telehealth and wearables) are expected to jump substantially in the wake of COVID-19 and 5G deployment
Drivers: Population change, population change in ages 75 and up, uninsured population, government spending, nonresidential structure investment
Educational
- Fall start in 2020 has been challenging, anticipate significant revenue losses across both K-12 and higher education
- Industrywide prioritization in renovations/retrofits and refining an online presence
- Increased focus on facility design in safety and well-being
- Maintenance backlogs receive much needed support through future infrastructure stimulus
Drivers: Population change younger than age 18, population change ages 18-24, stock markets, government spending, nonresidential structure investment
Religious
- Religious charitable giving was up in 2019 and is expected to end higher in 2020
- Declining attendance and religious affiliation
- Shelter-in-place mandates, rising unemployment and weakening consumer confidence challenge traditional revenue streams
- Ongoing shift away from traditional worship facilities into community-focused service and gathering places
Drivers: GDP, population, income, personal savings
Public Safety
- Rising crime rates and social unrest continue into 2021, imparting heightened demand for correctional facility investments in large metropolitans
- Local and state department budgets at risk of falling short in coming years
Drivers: Population, government spending, incarceration rate, nonresidential structure investment
Amusement and Recreation
- Pandemic-related reduced travel, event closures and crowd/capacity restrictions continue well into 2021
- Public support for convention centers, stadiums, parks and casinos is shelved alongside ongoing economic uncertainty and budgetary pressures
- Future bankruptcy and/or restructuring announcements are anticipated
Drivers: Income, personal savings rate, unemployment rate, employment
Transportation
- Transit/rail and airline ridership remains depressed into 2021; canceled and/or postponed megaprojects result in a multiyear adjustment in spending
- Freight rail expansion is upheld alongside increased investment in warehouse/logistics and e-commerce
- New federal infrastructure bill will support increased spending as a means to drive economic recovery; timing is expected late 2021 or 2022
Drivers: Population, government spending, transportation funding
Communication
- Demographic shifts support broad communication infrastructure investment into secondary and tertiary submarkets; fifth-generation (5G) iPhone sees 2020 release
- Increased human and device/machine internet traffic drives demand for data storage and edge processing
- Communications investment will be prioritized and highlighted in upcoming federal infrastructure and stimulus packages
Drivers: Population, security/regulation standards, private investment, innovation/technology investment
Manufacturing
- Supply chain disruptions overlaid with upheld consumer spending on durable and nondurable goods has signaled a need for expansion in select sectors
- Political/tax uncertainty, ongoing trade tensions and oil prices remain critical factors
- Large-scale planned petrochemical and transportation equipment investments will remain challenged
- Increased investment directed into automation and robotics
Drivers: PMI, industrial production, capacity utilization, durable goods orders, manufacturing inventories
NONBUILDING STRUCTURES CONSTRUCTION PUT IN PLACE
Power
- Oil and gas prices will remain fragile into 2021 (and possibly beyond) alongside global trade tensions
- Resiliency improvements, regulatory requirements and electrification trends are expected to help offset short and midterm losses in oil and gas spending
- Demand expected to increase for large-scale renewable projects
Drivers: Population, industrial production, government spending
Highway and Street
- Passage of the successor to the FAST Act (expiring 2020) is not expected until late 2021 or 2022, but is likely to provide a substantial increase in annual funding levels
- State and local budgets (and capital plans) will continue to become strained with lower tax collections
- Any future economic stimulus into highway and street infrastructure will be directed into shovel-ready and resurfacing projects
Drivers: Population, government spending, nonresidential structure investment
Sewage and Waste Disposal
- Demand tapers with reduced overall development (residential and nonresidential), counterbalanced against greater conservation measures tied to higher usage rates
- Investment in new infrastructure follows demographic patterns into growing secondary and tertiary markets
- Passage of America’s Water Infrastructure Act in late 2018 and reauthorization of the Water Infrastructure Finance and Innovation Act (WIFIA) provide some stability in capital plans
Drivers: Population, industrial production, government spending
Water Supply
- Future infrastructure stimulus and low borrowing costs are expected to help uphold spending levels
- Demand will slowly follow demographic shifts and overall reduced nonresidential and residential development
- The Water Quality Protection and Jobs Creation Act of 2019 injects billions into the Clean Water State Revolving Fund through the forecast period
Drivers: Population, industrial production, government spending
Conservation and Development
- Ongoing USACE spending tied to 2019 Disaster Relief bill efforts
- Low oil prices and declining nonresidential and industrial development limit short-term demand
- EPA budgets will remain in contention through the 2020 presidential election, shift in power could significantly boost annual investment
Drivers: Population, government spending
 Jay Bowman is a principal with FMI. Jay assists a broad range of stakeholders in the construction industry, from program managers and general contractors to specialty trades and materials producers, with the identification and assessment of the risks influencing the strategic and tactical decisions they face. In this role, Jay’s primary responsibilities include research design and interpretation, based on developing an understanding of the context within which these organizations operate. Jay can be reached at [email protected].
 Brian Strawberry is a senior economist with FMI. Brian’s expertise is in economic and statistical modeling. He leads FMI’s efforts in market sizing, forecasting, and building product/construction material pricing and consumption trends. Brian’s combination of analytical skills and creative problem-solving abilities has proven valuable for many contractors, owners and private equity groups as well as industry associations and internal research initiatives. Brian can be reached at [email protected].
 Emily Beardall is a senior analyst for FMI’s strategy practice. Emily is responsible for creating and developing tools to deliver innovative solutions for our clients. She is committed to utilizing these strategic tools to improve company performance and profitability. Emily can be reached at [email protected].