Beyond the Buzz: Harnessing the Power of Data Analytics in Construction
Data analytics continues to be a hot topic, with many businesses and industries seeking to leverage data-driven insights to improve performance and gain competitive advantages.
While data analytics is a powerful tool, it has also become something of a buzzword, with many companies rushing to purchase the newest, shiniest and most expensive software without fully understanding the potential benefits or how to effectively implement data analytics.
Construction is no exception to this trend. As the engineering and construction (E&C) industry becomes increasingly technology-driven, construction companies are turning to data analytics to improve operations and gain a competitive edge.
But with so much buzz around data analytics, it can be difficult to separate the hype from reality. Data analytics can be a valuable tool in the construction industry, helping companies make informed decisions by analyzing relevant project data.
What Do We Mean by Data?
The data used in construction projects can cover various aspects such as:
- Project schedules: This includes deadlines, labor hours and equipment utilization.
- Costs: Data would include points like materials, labor, equipment and subcontract expenses.
- Quality: This would capture rework, inspection results and customer satisfaction.
- Safety: This would encompass accidents, near misses and safety training hours.
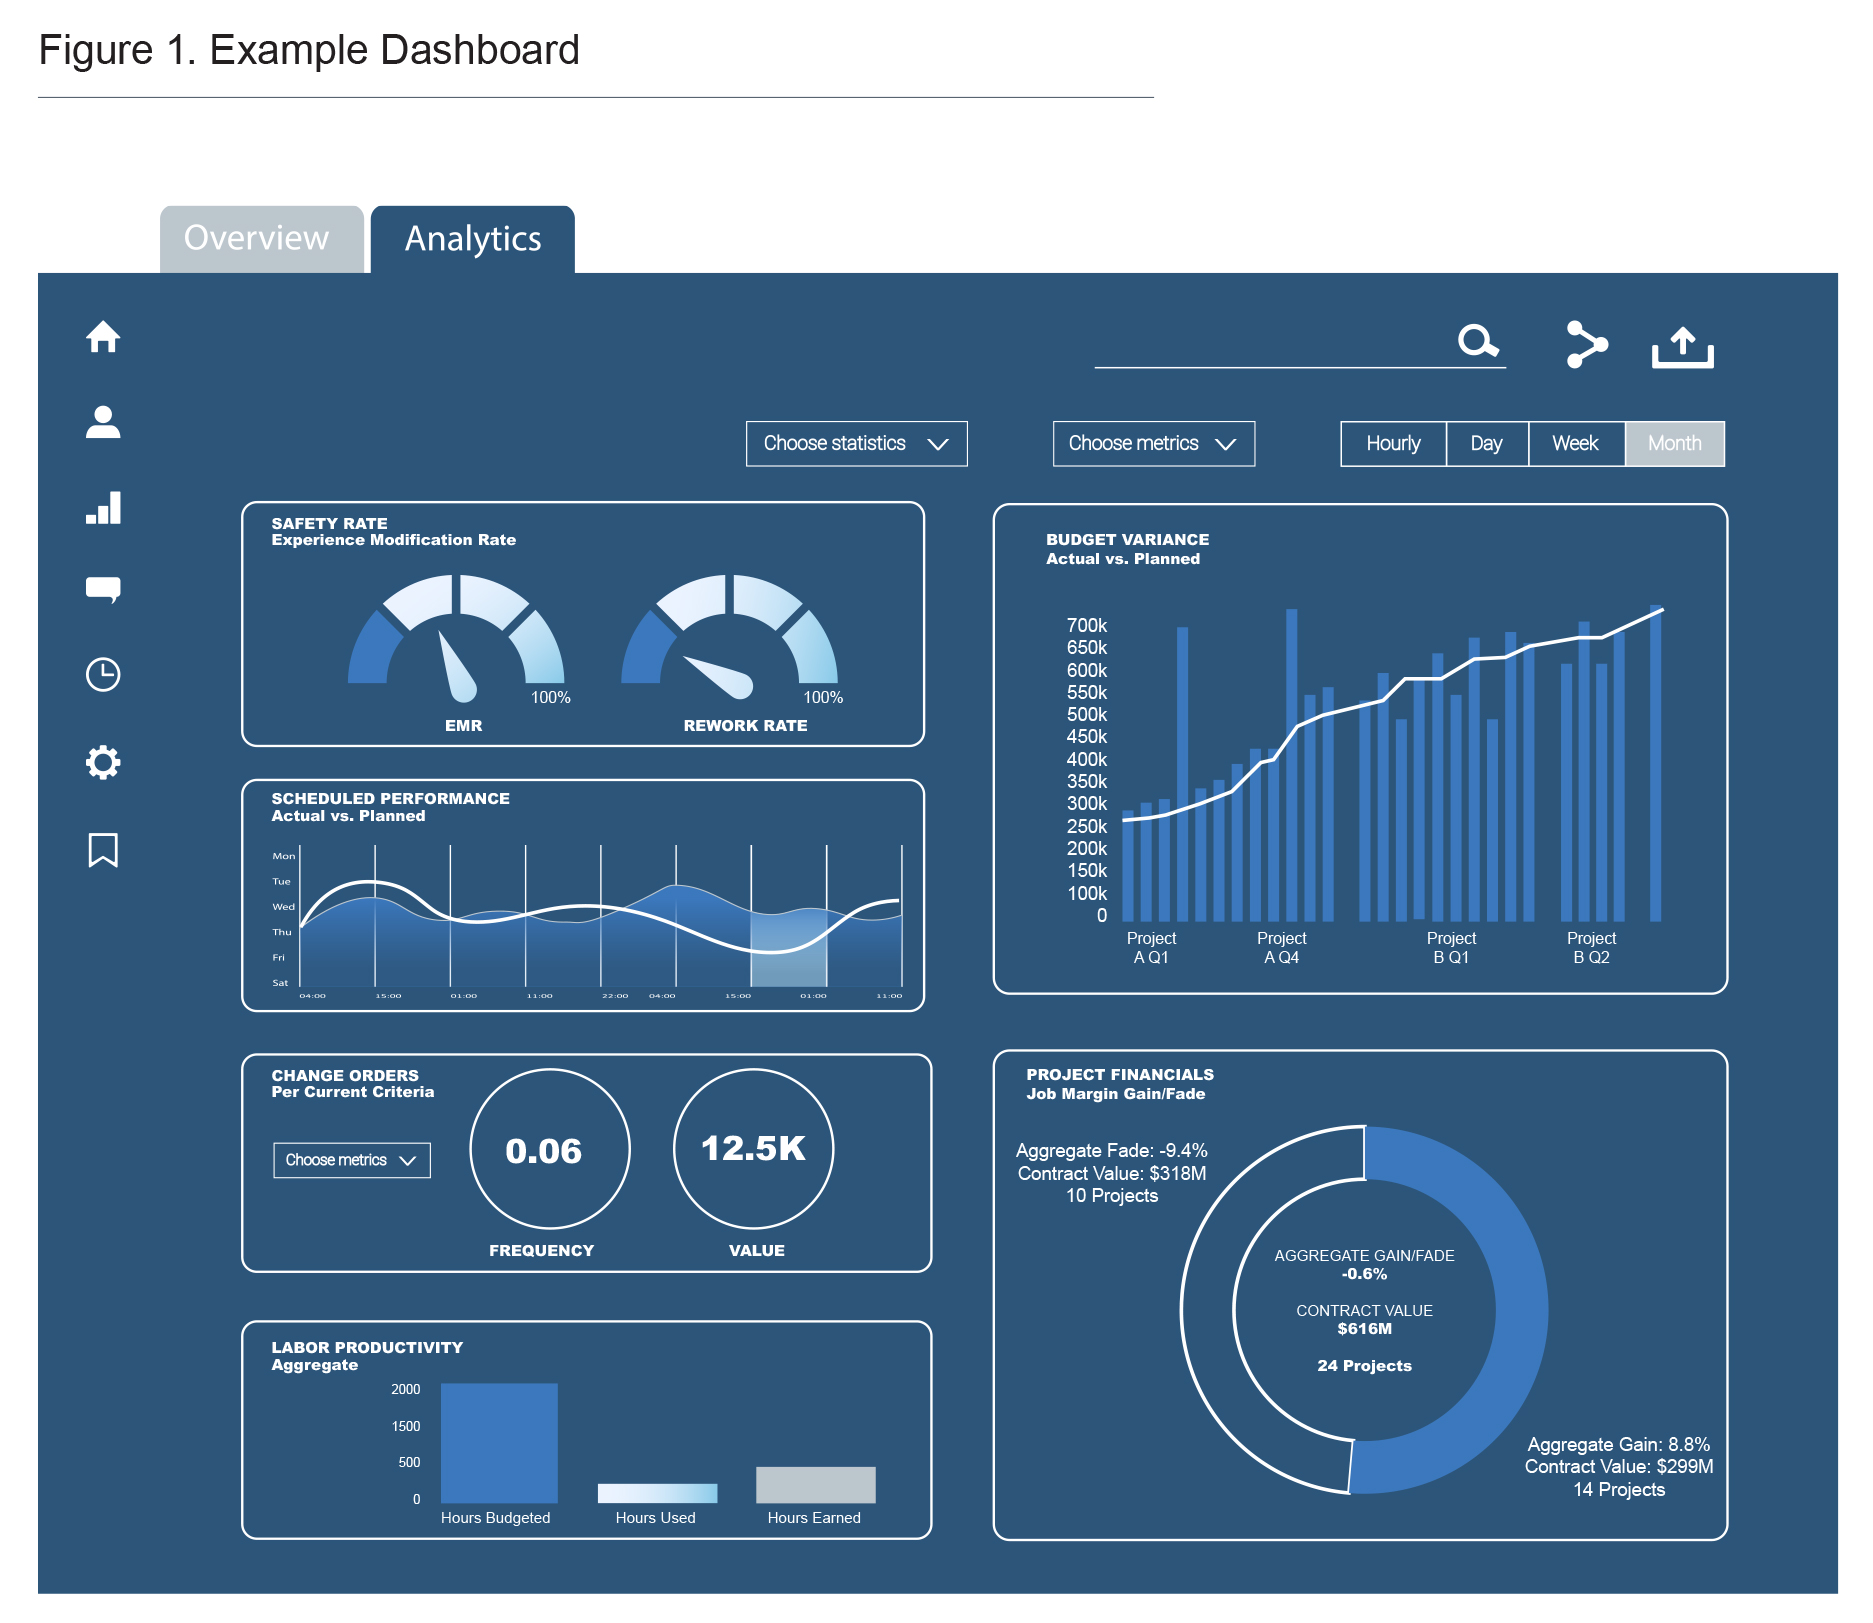
A dashboard is a simple but effective business operations tool that allows you to monitor these data points in real time, giving you a snapshot of the overall health of your projects and company performance. By analyzing these data points, you can make predictions, discover connections between data, and more effectively identify customer or market segments.
The Cost of Bad Data
Data analytics in construction is still in its early stages, with much of the generated data going unused. In 2020 the construction industry lost $1.84 trillion due to poor data management, with 14% of construction rework attributed to bad data, according to an FMI and Autodesk survey. With only 55% of construction companies having a formal data plan, the misuse of critical information is leading to poor decisions and costly rework, according to the same survey.
As data and technology grow, it is crucial for construction companies to stay ahead of trends. The amount of data generated is increasing rapidly (200% from 2019 to 2021), but 96% of it goes unused in the construction and engineering industry.
Data volume is expected to continue to grow, with the United States alone projected to increase at a 61% compound annual growth rate through 2025. By 2025, there could be 175 zettabytes of data, equivalent to the capacity of over 175 billion iPhone 14 Pros. To stay ahead, construction companies need to implement a robust data analytics strategy to effectively analyze and utilize the vast amounts of data generated in the industry.
Maximize the Potential of Data Through Analysis
To get the most out of data analytics, companies should gather data using manual methods or software, organize it, perform analysis to identify trends and patterns, and present the insights in an understandable way.
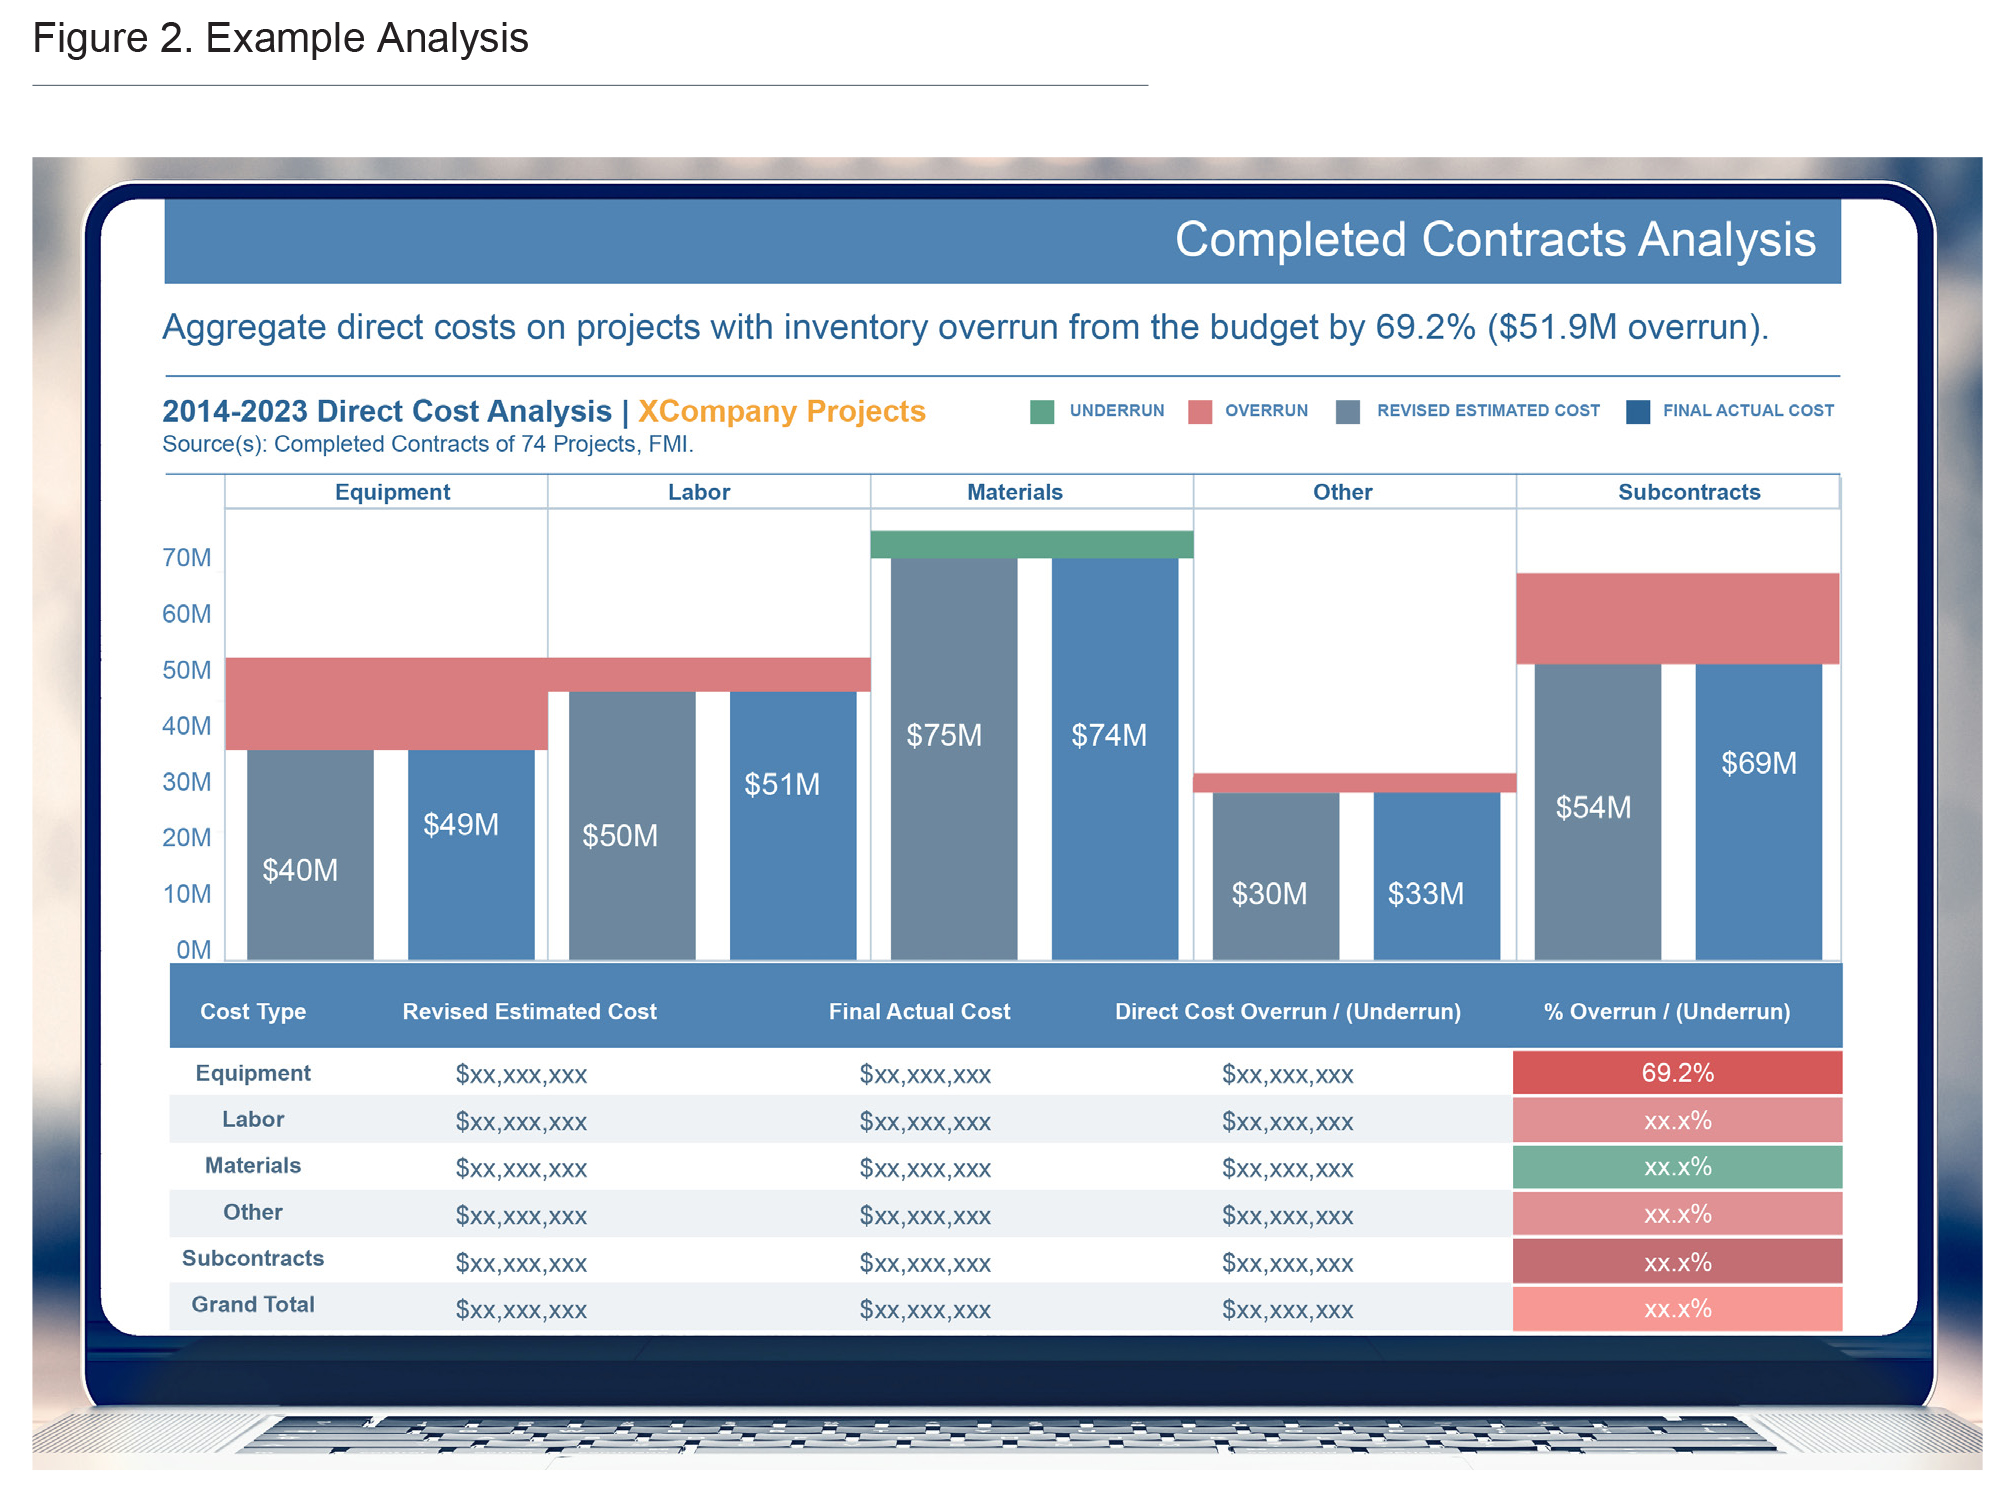
In construction performance evaluations conducted by FMI, two key data points analyzed are the comparison of estimated versus actual project profit margins and estimated versus actual direct costs. Known as margin gain/fade analysis and direct cost overrun/underrun analysis, these calculations help determine the direct costs that may have caused a project to underperform compared to the original estimate. By conducting both analyses together, companies can identify which costs had the greatest impact on profit margins and take steps to improve them.
If you’re a general contractor or construction manager who doesn’t self-perform and has limited direct cost data to track, a margin gain/fade analysis can still be useful. By analyzing your worst-performing projects, you can determine the patterns that are contributing to underperformance by analyzing the data by different attributes such as the owner/client, design team, subcontractors, geographic location, type of project, etc. By recognizing patterns in the data, you can identify the variables that are having the greatest impact on project margins and take action to address them. Understanding the potential that data analytics offers when implemented correctly can help improve performance and give you an edge over competitors.
Separating Fact From Fiction
One of the main misconceptions about data analytics is that it’s only for large companies with deep pockets and vast amounts of information to process. While it’s true that bigger firms have more resources, small- and medium-sized firms can also benefit from
these tools and the insights they provide.
The key is to start with defining the goals data analytics can help achieve and then building from that base. For example, by performing margin analyses, a large mechanical, electrical and plumbing (MEP) contractor specializing in equipment-intensive projects found that working with a specific client resulted in a net 17% margin fade, and equipment costs exceeded the budget by 55% on average, leading to a net loss of $8 million over a period of four years.
This finding does not necessarily indicate that the contractor should stop working with the client (although it should be considered), but it does indicate the need for a specific goal to reduce equipment cost overruns on projects with this client.
To achieve this, the contractor should first analyze the equipment utilization metrics to identify potential opportunities for margin improvement through retiring equipment that frequently needs maintenance or implementing more robust maintenance schedules. By taking an incremental approach and starting with specific problems or goals, companies can quickly see t he benefits of data analytics and build on that success to tackle bigger challenges.
Anyone Can Benefit From Data Analytics
Another myth is that data analytics is only for information technology professionals and only they can comprehend it. This should not be the case. Anyone with access to data in the organization can benefit from these tools, and it’s important for construction companies to engage all relevant stakeholders in the analytics process, including project managers, field engineers and others with direct access to data. Effective data analytics presents information in clear, concise visual forms such as charts, graphs and interactive displays. Just as precise drawings are crucial for the success of a construction project, clear and understandable visualizations are crucial for making well-informed, data-driven decisions.
Finally, it’s important to note that data analytics is not solely about the buzzword of “big data.” This term refers to massive or complex data sets that can’t be processed with common data tools like Excel or Access. While utilizing big data can offer valuable insights, it’s not a must-have for harnessing powerful insights in data analytics.
Data Analytics in Action
For example, a large-scale infrastructure company uses data analytics to identify and predict bottlenecks in construction. Taking data from a variety of sources, such as building information modeling (BIM), sensor data and project management software, the company creates a virtual representation of the project – or what we call a digital twin. This allows the operations team to analyze project data in real time, identify bottlenecks and predict potential issues before they occur.
Many heavy civil companies struggle with tracking equipment utilization at some point in the business life cycle. Analyzing data from equipment utilization metrics, gathered from either manual entry or using remote telematics that automatically track location and usage, will determine if and predict when equipment is showing signs of wear and tear. These data analytics systems can project potential downtime, allowing the firm to proactively schedule maintenance and minimize disruption to the construction schedule.
Additionally, using data analytics to track and analyze supply chain logistics such as materials deliveries, inventory levels and transportation schedules can identify potential delays, allowing companies to mitigate them before they occur.
Maintaining a steady flow of materials to the construction site and minimizing disruptions to the schedule can also be achieved through relatively simple analytics. In short, firms can use data analytics to improve the efficiency of projects and minimize downtime and delays, increasing profitability and ensuring on-time project delivery.
How to Get Started With Data Analytics
Data analytics is a powerful tool that can help organizations achieve greater efficiency and profitability. By leveraging data-driven insights, you can make better decisions, minimize project risks and improve the performance of your construction projects.
To maximize the benefits of data analytics, it’s important to adopt a strategic approach. Here are some tips to help you get started:
- Define your goals and objectives. Clearly articulate what you plan to achieve through data analytics and what key performance indicators you want to track.
- Assess your current data landscape. Take stock of the data you already have, identify what data is missing, and determine what data you need to collect.
- Choose the right tools and technologies. Consider the size, complexity and nature of your data and choose the appropriate analytics tools and technologies.
- Engage all relevant stakeholders. Make sure everyone who needs to be involved in the analytics process is involved, from project managers and field engineers to IT professionals.
- Continuously measure and monitor your results. Regularly measure the impact of your data analytics efforts and adjust as necessary to ensure you are achieving your goals and objectives.
By taking these steps and building a strong foundation for data analytics, you can unlock the full potential of data-driven insights and drive greater operational success.